According to the National Weather Service, storms from Hurricane Harvey have dumped more than 51 inches in certain areas of Texas, making it the most extreme rain event ever recorded in U.S. history.
The service announced that its gauge at Cedar Bayou on FM 1942 near Houston recorded 51.88 inches -- the most rain ever recorded from a single rain event. To make matters worse, dozens of other gauges along the south and southeastern coast measured from from 22 to 49 inches.
This amount of rainfall was enough for the State of Texas to declare a state of disaster for 33 counties and cause catastrophic flooding that resulted in the evacuation of thousands of people, the destruction of countless homes and at least 20 deaths.
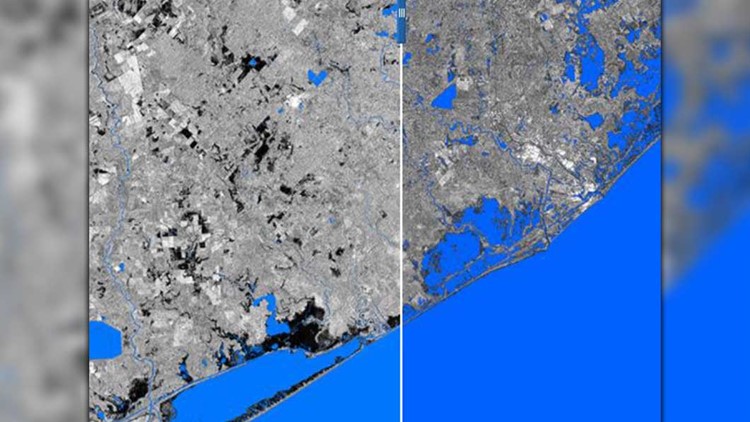
An interactive map using imagery from the TerraSAR-X radar satellite can help show the extent of this flooding. The artificially colored blue areas illustrate water detected before and after the storm. (Note: Sliding function does not operate on mobile devices.)
(CREDIT: DLR e.V. 2017 and Airbus Defence and Space GmbH2017)


