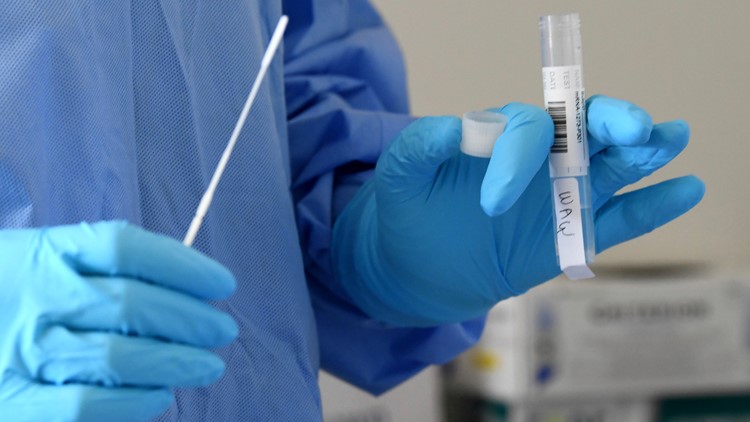
Many local leaders and residents in North Texas are working to make decisions based on the COVID-19 data available.
This is a look through some of the outlying counties in North Texas and how COVID-19 has impacted those areas.
Ellis County
Ellis County had its first day with more than 100 daily cases on June 24. From June 30 to Aug. 18, the county had more than 100 cases on nine different days, with the record coming on Aug. 11 with 265 cases.
During that nearly two-month stretch, Ellis County averaged 54.44 cases a day.
From Aug. 19 to Oct. 6, the county has seen a decline in reported cases. During that stretch, Ellis County has averaged 19.4 reported cases a day while only breaking 100 cases once on Sept. 15.
Johnson County
Johnson County saw its record daily high on July 8 with 184 new cases. From that day until Aug. 18, the county saw its worst stretch, averaging 42.07 cases a day.
Johnson County then saw a significant decline from Aug. 19 to Sept. 14, averaging 12.33 cases a day. However, in the past three weeks, from Sept. 15 to Oct. 6, the numbers have gone up again. During that time, Johnson County averaged 24.23 cases a day.
Erath County
Erath County started to see its case count rise in late June. However, the county's daily case count has remained relatively consistent since that point.
The county's highest reported daily cases came on back-to-back days on July 28 (34 cases) and July 29 (41 cases). The county has had more than 30 reported cases only two other days since tracking began in March 24.
From June 24 to Oct. 6, the daily average was 8.03 cases.
Parker County
From March 23 to June 22, Parker County had one day with double-digit cases reported in a single day on June 9 (12 cases).
The county saw its worse period of reported cases from June 23 to Aug. 22, averaging 23.87 cases a day.
Since that point, Parker County's case count has started to decline.
During the past 14 days, that two-month average from the summer has been nearly cut in half, down to 12.57 cases a day.
Palo Pinto County
Similar to nearby Parker County, Palo Pinto County had one day with double-digit cases from March 23 to July 20 on July 14 (15 cases).
Then from July 21 to Aug. 19, Palo Pinto County had double-digit cases reported on 15 days, averaging 10.13 cases a day. The county's highest reported day came on on Aug. 11 with 32 cases.
The past 14 days, Palo Pinto County has averaged 5.14 cases a day with the highest daily total coming on Sept. 29 with 21 cases.
Grayson County
Grayson County has remained consistent with its daily case count. State officials have been reporting around 10-30 cases a day.
There have been two outliers when Grayson County set a daily record on May 21 with 69 cases and then broke it again on Sept. 16 with 167 cases.
The county has had more than 40 daily cases only three other days since the first reported case on March 24.
From Apr. 29 to Oct. 6, Grayson County has averaged 12.11 cases a day.
Hunt County
Since late June when Hunt County's daily case count started to increase, the county has remained fairly consistent with its daily case count.
The county has broken 40 daily cases only seven times. Every case came from June 24 to Aug 8. Hunt County saw its record daily case count on July 7 with 83 cases.
From June 5 to Oct. 6, the county averaged 12.98 cases a day.
Rockwall County
Similar to nearby Hunt County, Rockwall County has remained consistent in its reported daily cases other than a few outliers.
The County's first big spike came on June 24 when it reported 45 cases. There have been more than 100 cases only twice on Aug. 11 (135) and Aug. 18 (136). The third-highest daily count came on Aug. 7 (62).
From June 24 to Oct. 6, Rockwall averaged 13.99 cases a day. During the past 14 days, Rockwall County has averaged 9.93 cases a day.
Henderson County
Henderson County saw a shorter period of time compared to other North Texas counties when its daily reported case counts were spiking.
From July 7 to Aug. 4, the county hit its two daily record highs on July 14 (63) and July 21 (50).
During that time period, Henderson County averaged 15.03 cases a day.
The numbers have declined the past two months. From Aug. 5 to Oct. 6, the county had more than 20 cases only two days, averaging 6.89 cases a day.
Van Zandt County
Similar to nearby Henderson County, Van Zandt County had a rise in cases for about a month.
From July 8 to Aug. 18, the county averaged 8.0 cases a day, hitting a daily high on Aug. 12 with 38 cases.
From Aug. 19 to Oct. 6, Van Zandt County has hit double-digit daily cases only once. The county averaged 2.87 cases a day during that time.
Hill County
Hill County saw its worst month of cases in September.
When the county saw its first increase in cases in July, it was averaged 7.74 cases a day.
In August, Hill County averaged 2.03 cases a day.
During September, Hill County averaged a monthly record of 10.77 daily cases.
On Sept. 11, Hill County was averaging 2.40 cases a day during a five-month stretch since the first reported case.
From Sept. 12 to Sept. 30, the county averaged 15.42 cases a day.
So far through six days in October, the daily case count dropped to 4.17 cases a day.


