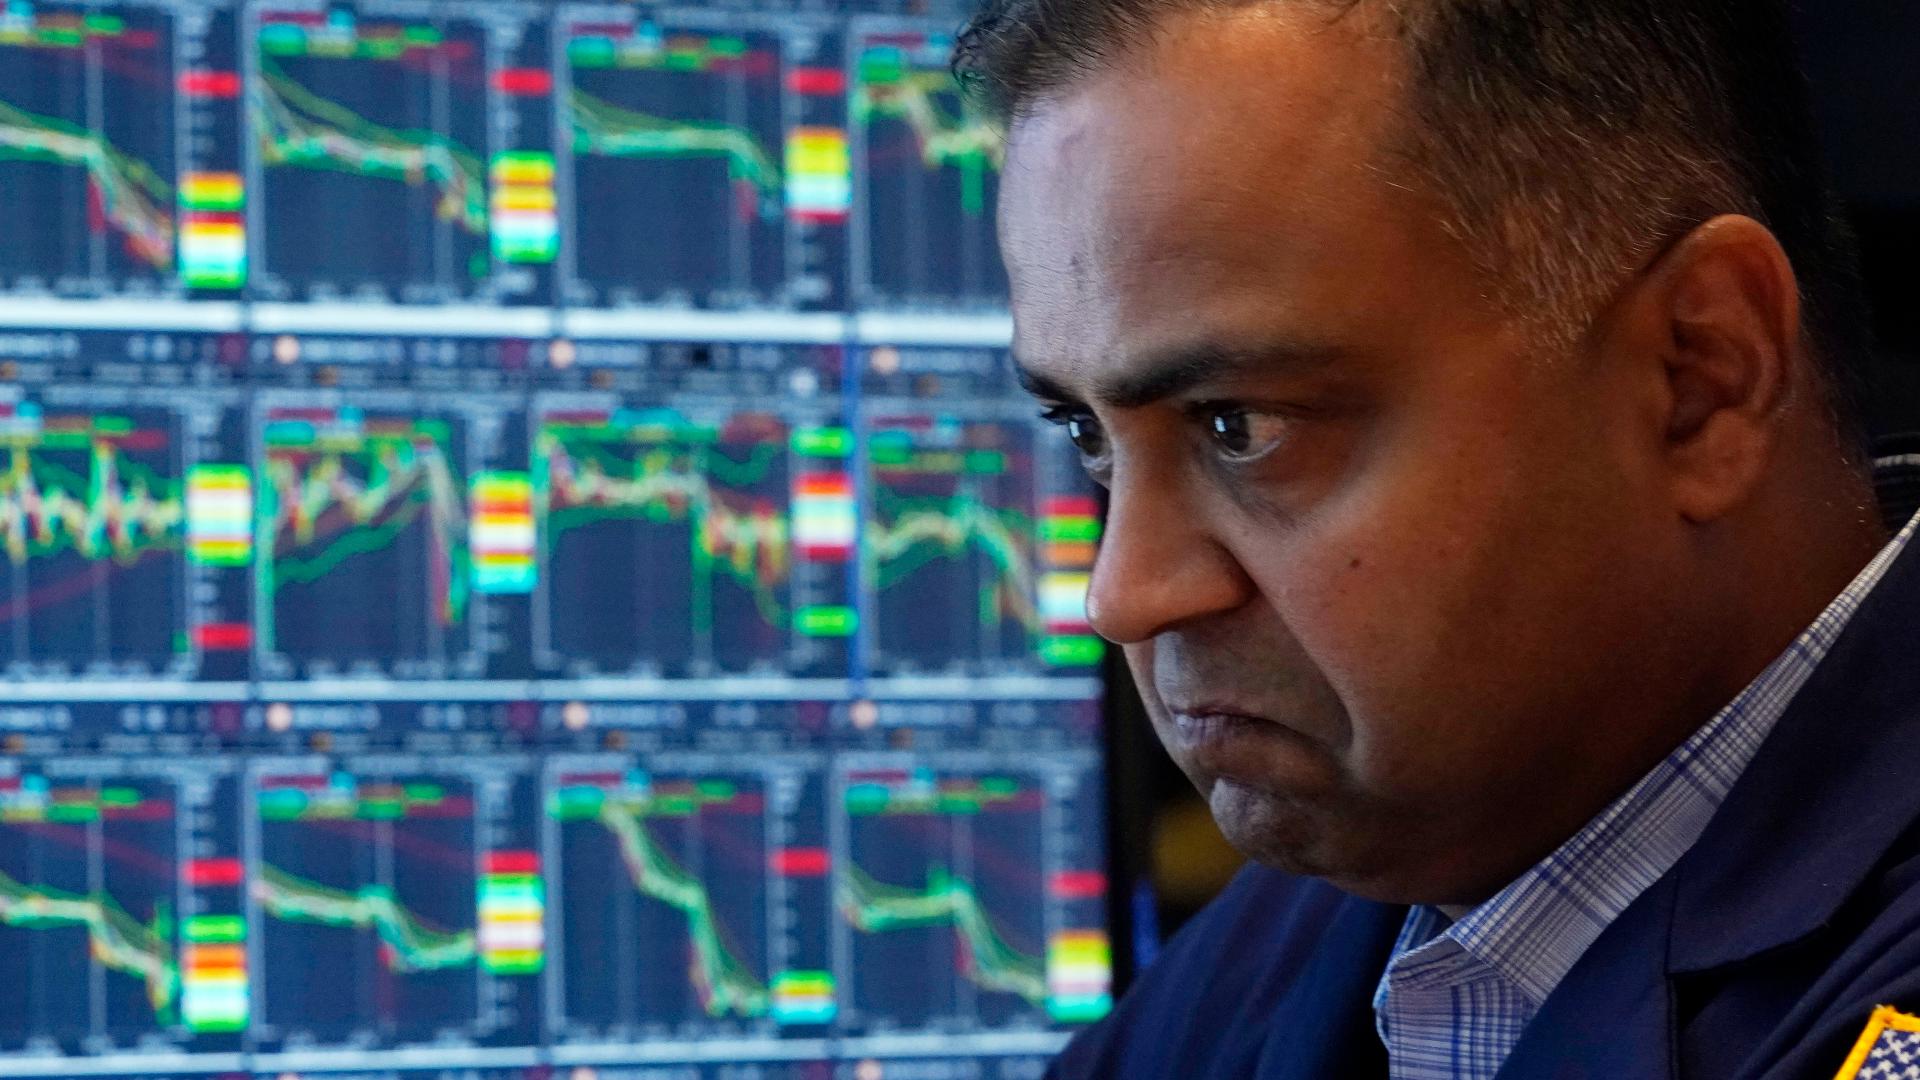
DALLAS — As the stock market has risen in recent years, lifting my investment accounts with it, I have been resting easier…sometimes even being able to dream of someday retiring comfortably. But sometimes we have those really cringey market days–including several of them lately–that make me stop resting and get up so that I can keep working hard and so I can free up my pillow so I can hold it and scream into it.
Staying in when it's hard to stay in!
On the terrible market days, that therapy is almost as soothing as an illustration in this report from JP Morgan. They figured if you invested $10,000 in January of 2004 into an index tied to the performance of the S&P 500, your initial $10,000 would have been worth well over $60,000 by January of this year. But they warned that if you had pulled your money out of the market from time to time and missed just the 20 best days in that entire 20-year period, your initial $10,000 investment in 2004 would grow to just under $20,000 by the start of 2024. Sure, it still would have gone up, but they pointed out that if you hadn’t missed those 20 best days, it would have gone up more than three times as much.
You might wonder why someone would pull their investments out for the best days. Sometimes, the really big loss days in the stock market push investors to pull their investments out for a bit until the market settles down. The problem is, JP Morgan notes that in those 20 years, seven of the best days came within 15 days of the 10 worst days. That’s a lot of numbers in one sentence. Essentially, they are saying that it is often the case that some of the worst market crashes occur within weeks of some of its most impressive runs higher.
Politics and investing
Since we are thinking about market history and this is a presidential election year, there is also a powerful argument for you to not quit the markets if your candidate doesn’t win. I don’t know of anyone who actually does this, but there’s another slamming chart that’s about this, so we will discuss it.
Charles Schwab used the S&P 500 as well and went all the way back to 1961 for this analysis. They figured that if you only invested under Republican presidents, an initial $10,000 investment would have grown to about $102,000 by 2023. Their math found that if you only played the market under Democratic presidents, your $10,000 investment would have grown to about $500,000. But here is the big takeaway: They reckoned that if you stayed in from 1961 through 2023, no matter whether the president was from the party of the elephant or the donkey, you transformed $10,000 into more than $5 million!
So, maybe you should consider separating your politics from your investing commitment, and just keep your pillow handy. You can always scream into that if the election outcome isn't what you wanted, or, as I do, you can do the same thing on these dreaded market plunge days.
Making your investments match the performance of the S&P 500
One last thing: both of the aforementioned analyses assumed investments in something that matches the S&P 500. I have heard from experts who tout how easy it is for novice investors to do well just by letting their money ride the performance of that index. They, and many articles like this one and this one, have noted that it is hard even for smart money managers to consistently beat the S&P 500. If you don’t know how to invest in a fund that follows the performance of the S&P 500, many workplace retirement plans offer at least one S&P 500 index fund.
If you are doing this in another account, like an IRA, you can log into your brokerage account (with Fidelity or Vanguard, for example) and search for S&P or 500 and see which offerings are available. There is more information about this here and here. If you still have questions or don’t feel confident going it alone, you should talk to your plan administrator or a financial advisor.

